FEATURES #02
What You Can Do with Wi-Flo
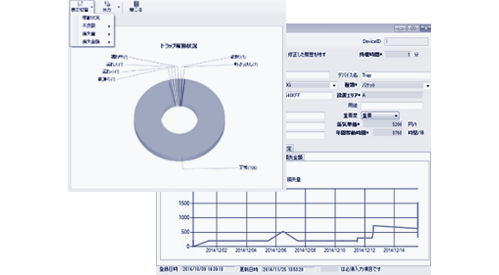
[Monitor]
Trap leakage, clog, and defect in pressure can be define in different color and monitor obviously.
It can monitor the loss of money and energy, and also increase the maintenance motivation.
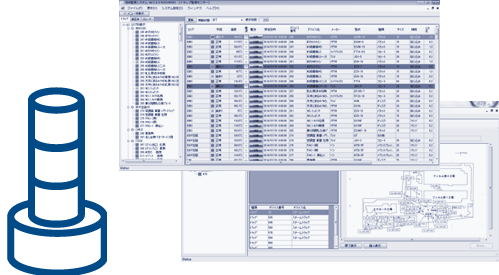
[MAP Function]
When the trap leakage, clog, and defect in pressure is detected, alarm will turn on immediately upon measurement.
Monitoring is available not only in data form on the monitor, but also in color-coded plot form on a map.
Accumulated data can be displayed in graph form. Trend analysis in graphs is useful for predictive maintenance.
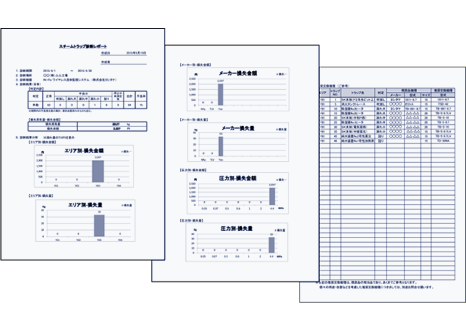
Diagnostic reports can be output for a specified period.
In addition to the overall quantity and amount of steam loss, quantity and amount of loss can be calculated by area, manufacturer, or pressure for each type of failure.
For defective steam traps, replacement models recommended by Yoshitake are automatically output.
The CSV data output function allows an interface with existing network systems.